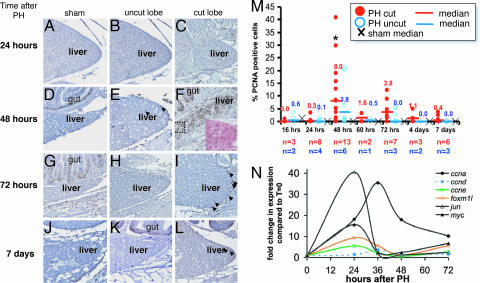
Fig. 4.
PCNA expression peaks at 48 h after PH. (A–L) PCNA immunostaining is indicated by brown nuclei. The gut lies medial to the dorsal liver lobe, serving as a positive control (see D, F, G, and K). Samples taken from sham operated animals (A, D, G, and J), and both the uncut (ventral) lobe (B, E, H, and K) and cut (dorsal) lobe (C, F, I, and L) of animals that underwent PH at 24 h (A–C), 48 h (D–F), 72 h (G–I), and 7 days (J–L) after surgery. Arrows indicate PCNA-positive hepatocyte nuclei. (F Inset) A magnification of the boxed region, stained with H&E. (M) The PCNA index was determined from the cut (red circles) and uncut (blue circles) lobes of PH animals, and the median is plotted as a bar with the value indicated above. The median PCNA index for sham animals is illustrated with an ×. ∗, a significant difference in the PCNA index in the cut lobe at 48 h compared with the cut lobe at 24 h (P < 0.0035) and 72 h (P < 0.095). (N) The remaining ventral lobe of zebrafish livers were collected at the indicated times after PH. The expression levels were determined in two fish by using Q-PCR with ef1a as a reference, the values were averaged and are plotted as fold change compared with expression levels in quiescent livers (t = 0) from five fish.

