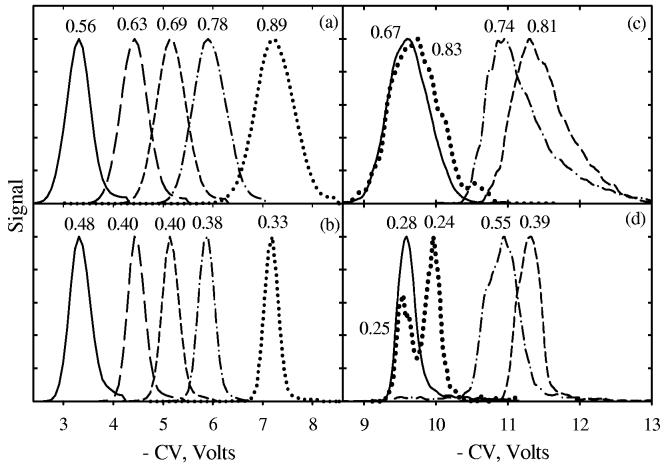
Fig. 7.
CV spectra of H+reserpine (a, b) and H+leucine/H+isoleucine (c, d) acquired using Selectra (a, c) [with Vmax = −4 kV (a) and 4 kV (c)] and p-FAIMS (b, d), in N2 (solid line) and He/N2 with He fraction of 20% (long dash), 30% (short dash), 40% (dash-dot), and 50% (dotted). For clarity, we plot only the major peak for reserpine (at CV = −3 V in Fig. 6a). Spectra in (b, d) were aligned with those in (a, c) to match the CVs at peak apexes. Measured fwhm values are given for all features.

