
Figure 2.
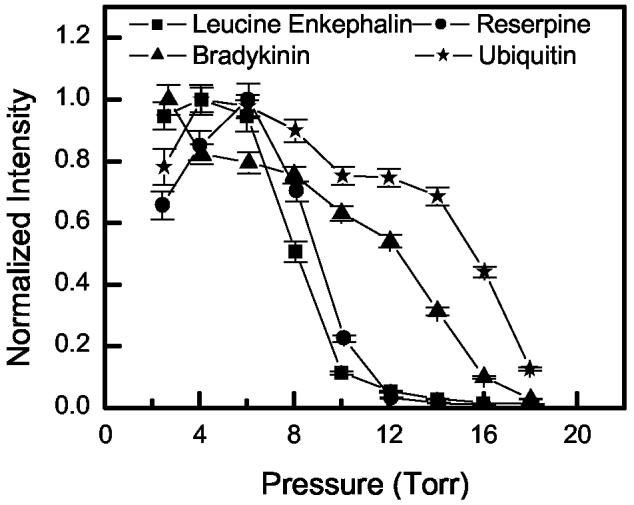
The transmission of Leucine Enkephalin, Reserpine, Bradykinin and Ubiquitin ions as a function of pressure. The data for Bradykinin represent the sum of 2+ and 3+ charge states, while the data for Ubiquitin represent the sum of 7+ to 13+ charge states. Each data set is normalized to its own high intensity point. Both ion funnels were operated at 560 kHz and 70 Vp-p.