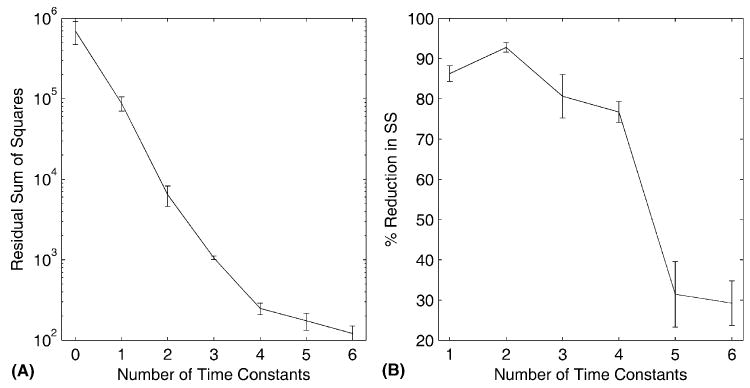
Fig. 3.

(A) Fitting errors plotted as a function of the number of TCs used for fitting. Fitting errors were calculated as the sum of squared errors for each animal’s data set. The value shown for zero fitted TC’s corresponds to the sum square amplitude of the original data sets before fitting. The plot shows group mean and the standard error of the mean. The y-axis uses a logarithmic scale. (B) The successive reduction in fitting error, expressed as a percentage, produced by fitting with each additional TC. The plot shows group mean and the standard error of the mean. The x-axis starts at one, corresponding to the reduction in variance of the original data sets produced by fitting a single TC.
