
Fig. 9.
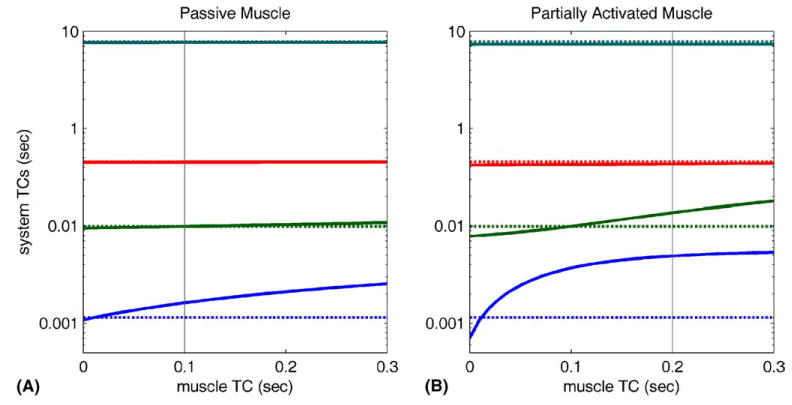
Overall system TCs for model shown in Fig. 8, plotted against the value of the eye muscle TC. Values for orbital tissue parameters were derived from present study (Appendix A) and from an estimate of 0.45 gf/deg for steady-state orbital stiffness (see text). (A) System TCs with passive muscle, here assumed to have a stiffness of 0.03 gf/deg. The broken lines show the values of the TCs for orbital tissue alone (not clearly visible for the two longest TCs). The vertical line corresponds to a muscle TC of 0.1 s. (B) System TCs for muscle activity generated by fixation at primary position, here assumed to produce a stiffness of 0.3 gf/deg. The broken lines show the values of the TCs for orbital tissue alone. The vertical line corresponds to a muscle TC of 0.2 s.