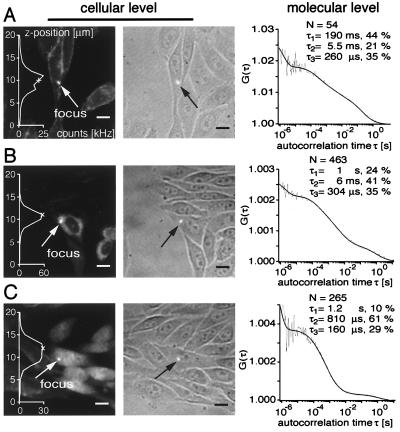
Figure 2.
FCM-based characterization of GFP fusion proteins localized in (A) the plasma membrane, (B) the ER, and (C) the cytoplasm. (Left) Subcellular distribution in three dimensions. Profiles along the optical axis are superimposed on the fluorescence micrographs; (Center) bright-field images; (Right) autocorrelation functions fitted with three diffusional components, triplet term, and offset. For the later analysis weighted means were calculated for relaxation times differing by less than one order of magnitude (Fig. 3). Bar = 10 μm.

