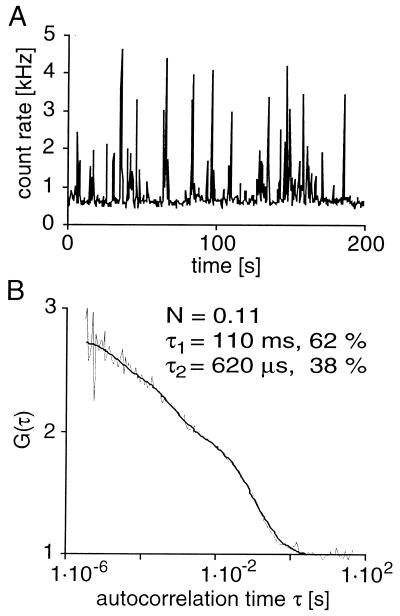
Figure 5.
FCM at low levels of intracellular EGFR-GFP fusion proteins. (A) Fluorescence count trace. The peaks in the fluorescence count trace likely represent single EGFR-GFP molecules diffusing through the detection volume. (B) Autocorrelation function and parameters derived from a two-component fit. The number of molecules derived from the autocorrelation amplitude was corrected for the uncorrelated background fluorescence, derived from peak-free count intervals according to Eq. 1. The excitation intensity was 3.8 kW/cm2.

