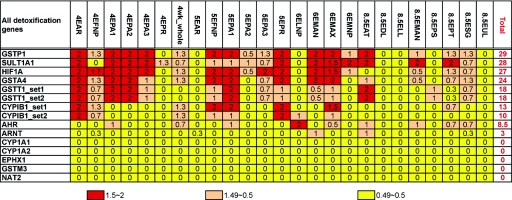
Figure 2. .
COGENE expression summary of detoxification genes. For evaluation of the expression level, the numerical values were assigned to the results of chip analysis with p (present)=2, m (marginal)=1, and a (absent)=0, and expression scores were calculated from the average of the replicate experiments. The column headings indicate the developmental stage and sample tissue.

