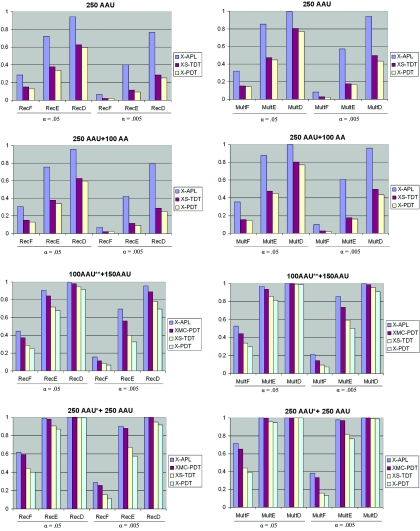
Figure 1. .
Power comparison for single-marker analysis. Power estimates for the single-marker X-APL, XS-TDT, XPDT, and XMCPDT were based on 2,000 simulated data sets. All families were simulated without parental data except AAU** families, which have both parents present, and AAU* families, which have one parental genotype missing. Power is calculated for both significance levels (α) of .05 and .005 for both the recessive and multiplicative models.

