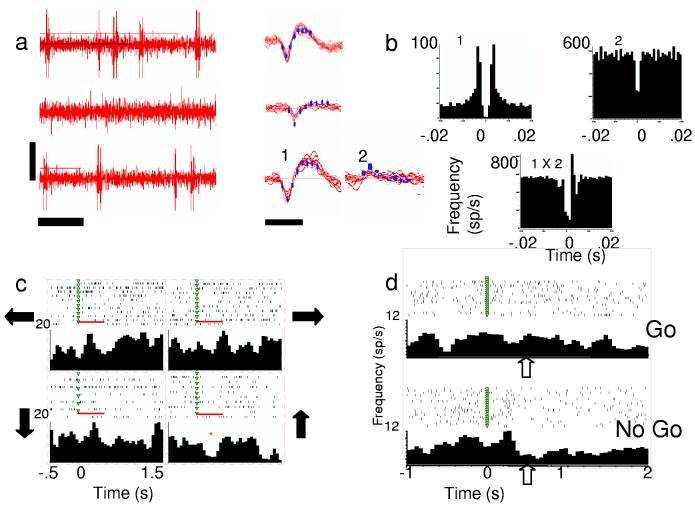
Figure 3.
Human cortical activity. a, Examples of neural activity. Left, oscilloscope-like trace (vertical bar=50 mV, horizontal bar= 50 ms). Right, corresponding discriminated neurons from those traces (bar=1 ms). 1,2 = two discriminated units (one single, one multi-unit) recorded from the same electrode in Patient 2. b, Autocorrelograms from the same two units (above) and cross-correlogram (below). These two were recorded on the same electrode and appear to be functionally connected based on cross correlation. c, Rasters and histograms from Cell 1 in a, aligned on IS1 during 4-direction task. Arrows indicate direction moved, red bar indicates 500-ms window tested for differences with direction. * indicates significant difference when tested with other directions (p< 0.05, Student's t-test). d, Perievent rasters and histograms from one neuron (Patient 3) during ‘Go’ and ‘No Go’ trials aligned on IS1 (green triangles). Clear arrows point to visible differences in firing rates in the two conditions.

