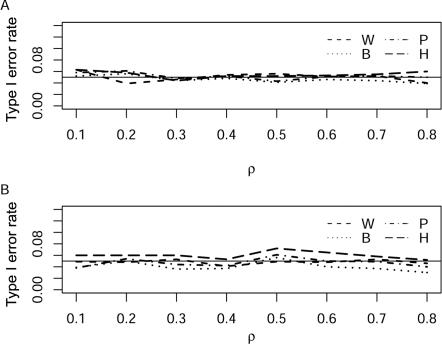
Figure 3. .
Type I error rates of four tests with m=4 (A) and m=10 (B) at the 5% level under different ρ values in simulations. The solid horizontal line is the nominal 0.05 level. Analysis is based on 100 cases and 100 controls, with ρ taking on the values 0.1, 0.2, 0.3,…, 0.8. The statistics TB, TP, TH, and Tw are denoted B, P, H, and W, respectively.

