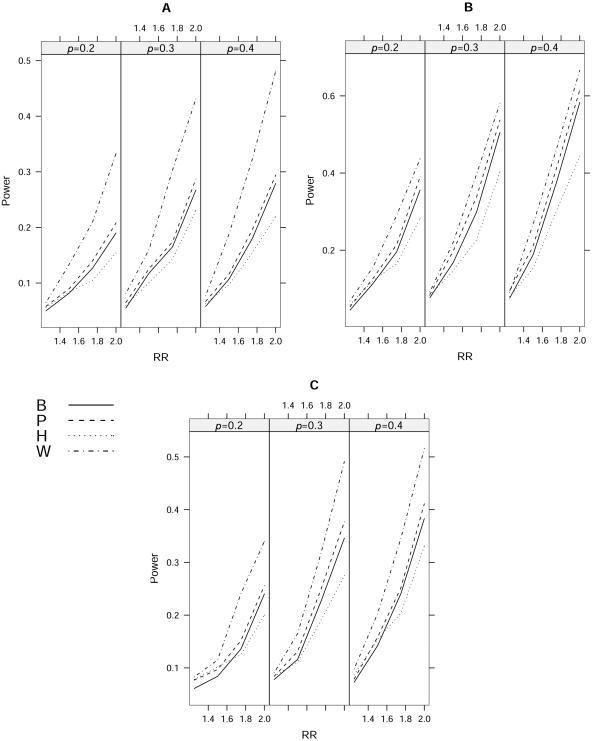
Figure 5. .
Empirical powers of different approaches with m=10 at the 5% level for a multiplicative model. The disease-allele frequency is given by p (0.2, 0.3, or 0.4). A, ρ=0.4. B, ρ=0.8|i-j|. C, ρ is sampled from a uniform distribution between 0.3 and 0.7. The statistics TB, TP, TH, and Tw are denoted B, P, H, and W, respectively.

