Figure 1. .
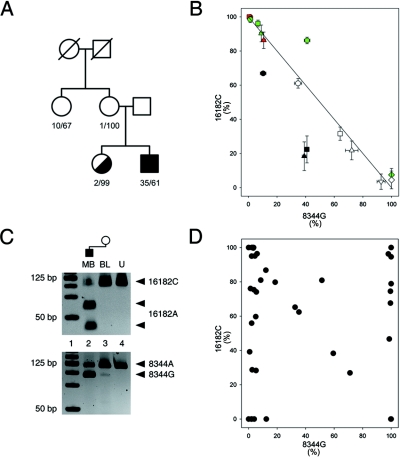
Family with A8344G and A16182C heteroplasmic mutations. A, Pedigree. The first number indicates the percentage of 8344G; the second number indicates the percentage of 16182C in blood samples of the family members. B, Apparent cosegregation of the 16182A allele with the 8344G allele in tissue samples of double-heteroplasmic individuals. Mutation loads were determined by RFLP and were confirmed by sequencing. Circle = blood; square = buccal cells; triangle = urine sediment; diamond = skeletal-muscle biopsy sample; hexagon = fibroblasts; inverse triangle = brain biopsy sample. Black indicates the sister of the patient’s mother; red indicates the patient’s mother; white indicates the patient; green indicates the patient’s sister. The 8344G mutant allele primarily co-occurs with the 16182A wild-type allele (and the 8344A wild-type allele with the d-loop mutant 16182C). A third allelic combination, the putative “original” wild-type 8344A/16182A, is present in the tissue samples of the sister of the patient’s mother (the data points are below the line). Data points above the line in the tissue samples of the patient’s sister indicate that 8344G also occurs in combination with the 16182C allele (the fourth allelic combination, double mutant, and the potential recombinant). C, The recombinant 8344G/16182C allele, present in the blood of the patient’s mother. Note the faint band indicating the presence of 8344G in the blood of the patient’s mother, whereas 16182A is virtually absent in this sample (lane 3), which confirms the presence of the recombinant 8344G/16182C. Lane 1, DNA ladder. Lane 2, Patient’s muscle biopsy (MB) sample. Lane 3, Blood of the patient’s mother (BL). Lane 4, Undigested PCR product (U). D, Distribution of the two heteroplasmic mtDNA mutations in single fibroblasts of the patient’s sister. Data points populate all four corners of the graph, which indicates tetraplasmy.

