Figure 2. .
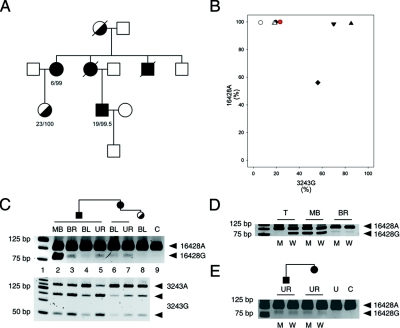
Family with A3243G and G16428A heteroplasmic mutations. A, Pedigree. The first number indicates the percentage of 3243G; the second number indicates the percentage of 16428A in blood samples of the family members. B, Apparent association of the 16428A allele with the 3243G allele in tissue samples of double-heteroplasmic individuals. The mutation loads were determined by RFLP and were confirmed by sequencing. Circle = blood; triangle = urine sediment; diamond = skeletal-muscle biopsy sample; inverse triangle = brain biopsy sample. Black = patient; red = daughter of the patient’s aunt; white = the patient’s aunt. C, Distribution of the heteroplasmic mutations in different tissue samples from the family members. Note the clear presence of 16428G in the samples of the patient’s maternal aunt (lane 7). Lane 1, DNA ladder. Lanes 2–5, Patient muscle biopsy (MB) sample, brain (BR), blood (BL), and urine sediment (UR). Lanes 6–7, Patient’s aunt's blood (BL) and urine sediment (UR). Lane 8, Patient’s cousin's blood (BL). Lane 9, Homoplamic 16428A control (C) (isolated PCR fragment). D, Tetraplasmic distribution of the two heteroplasmic mutations, A3243G and G16428A, in skeletal muscle (MB) and brain (BR) of the patient. Note the presence of both digested and undigested bands in the allele-specific reaction pairs. The potential recombinant 16428G/3243G is represented by the digested PCR product in the M lanes. M = mutant 3243G allele-specific PCR; W = wild-type 3243A allele-specific PCR. T = triplasmic control DNA mixture harboring wild-type, single-mutant 16428A and double-mutant 3243G/16428A mtDNA molecules. E, Tetraplasmy of the A3243G/G16428A alleles in urine sediments from the patient and his maternal aunt. Note the mtDNA tetraplasmy in both urine sediments, with the potential recombinant 16428G/3243G (digested PCR product in lanes M). U = undigested PCR product; C = control PCR product with the 16428A mutation.

