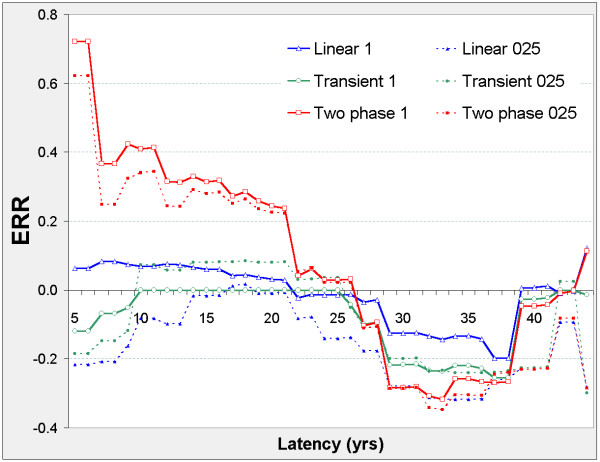
Figure 3.
Stomach cancer mortality in 0 – 20 mSv subcohort, ERR vs latency. For each model (two-phase in red, transient in green, linear in blue) fitted at fixed latency φ, series 1 (solid lines) shows the Excess Relative Risk ERR1 (ERR at 10 mSv lagged dose); series 025 (dotted lines) shows ERR0.025 (ERR at 0.25 mSv lagged dose). For latency φ and model definitions see Figure 2. For Linear 025 only, ERR0.025 is estimated from the 0 – 0.5 mSv data.

