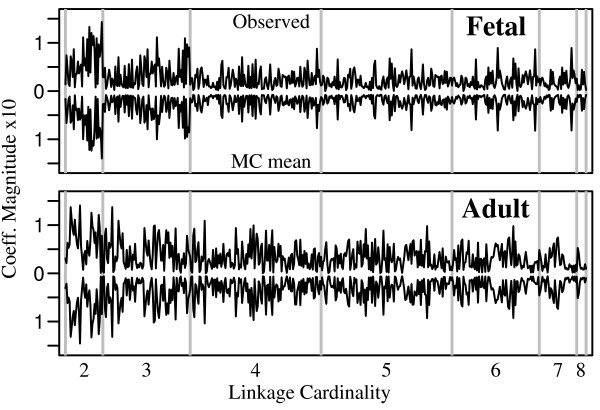
Figure 5.
Spliceprints. Log-linear coefficient magnitudes are plotted for all subsets of more than one locus. The vertical scale is the same for all traces. Within a cardinality, k, the sequence of coefficients is determined by listing the 9 loci from left to right as in Figure 4 (abscissa), and choosing groups of loci from left-most to right-most as follows: for loci A = 25A, B = 14, etc., cardinality-3 coefficients occur in the order ABC, ABD, ACD, BCD, ABE,..., PHI, GHI.

