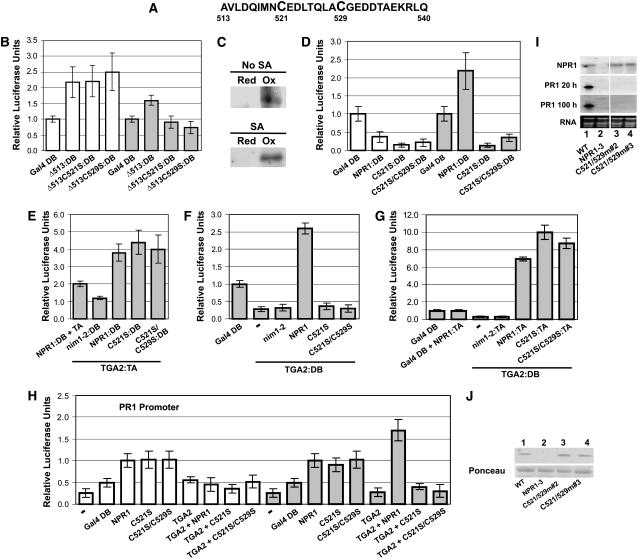
Figure 5.
Oxidation of Cys-521 and Cys-529 Correlates with Transcriptional Activation of the PR-1 Gene by the TGA2-NPR1 Complex.
(A) Sequence of amino acids located between positions 513 and 540.
(B) Histograms illustrating the transcriptional activity of the Δ513 deletion mutant of NPR1 and the effect of mutating Cys-521 or Cys-529 within the context of the Δ513 protein. Proteins were tethered to DNA through Gal4 DB.
(C) Blot analysis of NPR1Δ513 immunoprecipitate used to assess the in vivo redox status of residues Cys-521 and Cys-529 present in cells of Arabidopsis leaves treated for 24 h with SA (SA) or left untreated (No SA). Red indicates immunoprecipitates from proteins labeled for reduced Cys residues, and Ox indicates immunoprecipitates from proteins labeled for oxidized Cys (see Methods).
(D) Histograms illustrating the transcriptional activity of the full-length NPR1 and the effect of mutating Cys-521 or simultaneously Cys-521 and Cys-529 within the context of the full-length NPR1. Proteins were tethered to DNA through Gal4 DB.
(E) Histograms illustrating the interaction of NPR1 with the Cys-521 or the Cys-521 and Cys-529 mutants described for (D) with TGA2 fused to the VP16 transactivation domain. nim1-2, which does not interact with TGA2, was also expressed with TGA2:DB as a negative control. NPR1, nim1-2, and the mutants described for (D) were all fused to the Gal4 DB. NPR1:DB was also expressed along with the VP16 transactivation domain (NPR1:DB + TA) as another negative control.
(F) Histograms illustrating the effect of NPR1, Cys-521, or the Cys-521 and Cys-529 mutants described for (D) on the transcriptional activity of TGA2:DB. All proteins, except TGA2:DB, were expressed without a fusion.
(G) Histograms illustrating the interaction of NPR1, Cys-521, or the Cys-521 and Cys-529 mutants described for (D) all fused to the VP16 transactivation domain with TGA2 fused to the Gal4 DB.
For (B), (D), (E), (F), and (G), conditions were identical to those described for Figure 1. Data are reported as relative luciferase units. Values are from 25 samples and represent averages ± sd. Every bar represents five bombardments repeated five times (n = 25).
(H) Histograms illustrating the effect of NPR1, nim1-2, and the Cys-521 or the Cys-521 and Cys-529 mutants on the transcriptional activity of the TGA2-NPR1 complex. All proteins were native (without fusion). The reporter system was the Arabidopsis PR-1 promoter fused to luciferase. The CaMV 35S promoter:renilla luciferase fusion was used as an internal standard. − indicates that no effector was bombarded along with the reporter and internal standard vectors. Arabidopsis leaves were left untreated (white bars) or were treated for 24 h with 1 mM SA (gray bars). Data are reported as relative luciferase units. Values are from 25 samples and represent averages ± sd. Every bar represents five bombardments repeated five times (n = 25).
(I) RNA gel blot analysis using NPR1 or PR-1 probes. RNA stained with ethidium bromide is shown for loading comparison. Lane 1 contains RNA from wild-type Arabidopsis, and lane 2 contains RNA from the npr1-3 mutant. Lanes 3 and 4 contain RNA from two independent npr1-3 transgenic lines expressing NPR1 bearing Cys-to-Ser mutations at positions 521 and 529. Specific line numbers follow the construct name. PR1 20 h and PR1 100 h represent 20 h and 100 h of autoradiography, respectively. All lanes are from the same gel and blot.
(J) Top panel, immunoblot analysis of proteins from wild-type Arabidopsis, the npr1-3 mutant (NPR1-3), and the npr1-3 background lines expressing the mutant described for (I). An anti-NPR1 antibody (Després et al., 2000) was used. Bottom panel, Ponceau staining of the membranes shown in the top panel.

