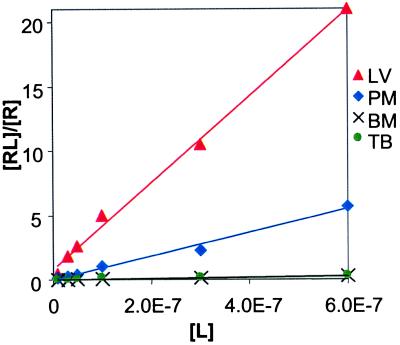
Figure 4.
Plot of (Complexed 16S)/(Free 16S) vs. aminoglycoside concentration for a mixture of paromomycin, lividomycin, tobramycin, and bekanamycin measured by using ESI-FT-ICR MS. Kd values were determined from the inverse of the slope for each line and have R2>0.95. Ribostamycin did not form a complex with 16S to an appreciable extent over this concentration range.

