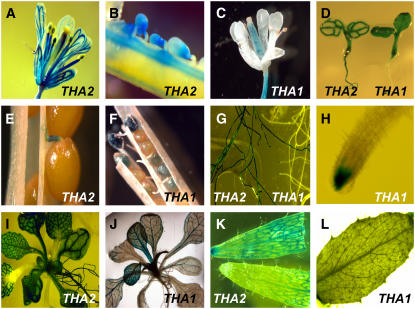
Figure 7.
GUS Promoter Fusions Show THA1 and THA2 Expression Patterns.
Expression of THA1-GUS and THA2-GUS promoter fusions in flowers and developing seeds ([A] to [C]), seedlings (D), almost-mature seeds ([E] and [F]), roots ([G] and [H]), 2-week-old rosettes ([I] and [J]), and cauline leaves ([K] and [L]).

