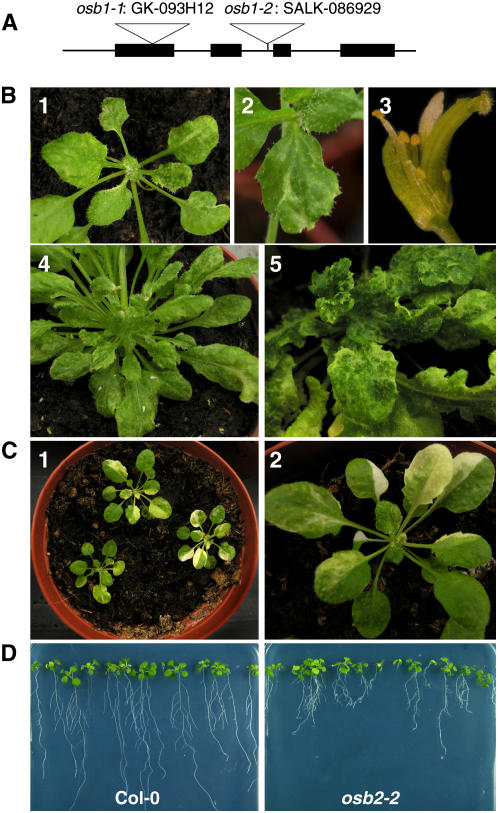
Figure 5.
Variegated and Distorted Phenotypes of At OSB1 T-DNA Insertion Mutants.
(A) Physical map of the At OSB1 gene. The positions of the T-DNA insertions in osb1-1 and osb1-2 mutants are indicated.
(B) Examples of variegation and distortion phenotypes in leaves and flowers of osb1-1 (panels 1, 2, and 4) and osb1-2 (panels 3 and 5) mutants.
(C) Examples of variegation in leaves of an msh1 T-DNA insertion mutant.
(D) Comparison of the roots from Col-0 and osb2-2 plants at 21 d after germination on Murashige and Skoog agar plates.

