Figure 6.
Clustering of Mitochondria in osb1 Mesophyll Cells.
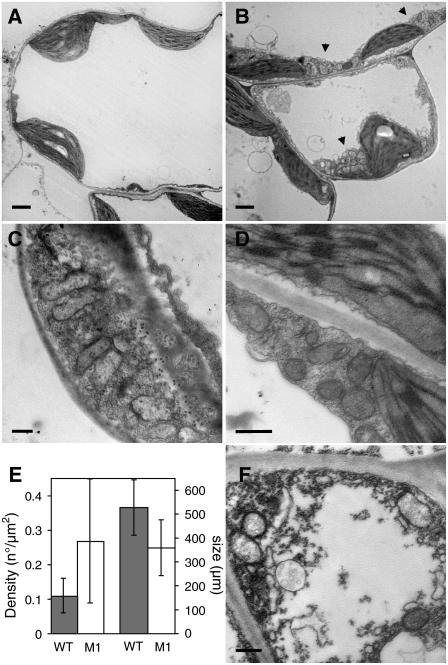
(A) and (B) Transmission electron microscopy of sections from variegated leaves of osb1-1 plants. Mesophyll cells from wild-type (A) and osb1-1 (B) plants, showing clusters of mitochondria in osb1-1 (arrowheads).
(C) and (D) Details of mesophyll cells from osb1-1, showing clusters of mitochondria and the accumulation of mitochondria in regions of cell wall ingrowths.
(E) Increase in the number and decrease in the size of mitochondria in osb1-1. The mean surface of mitochondria cross sections was obtained from the analysis of 20 electron microscopy images of wild-type and osb1-1 (M1) leaves. Error bars indicate sd.
(F) Abnormal mesophyll cell in osb1-1.
Bars = 2 μm in (A) and (B) and 500 nm in (C), (D), and (F).

