Figure 8.
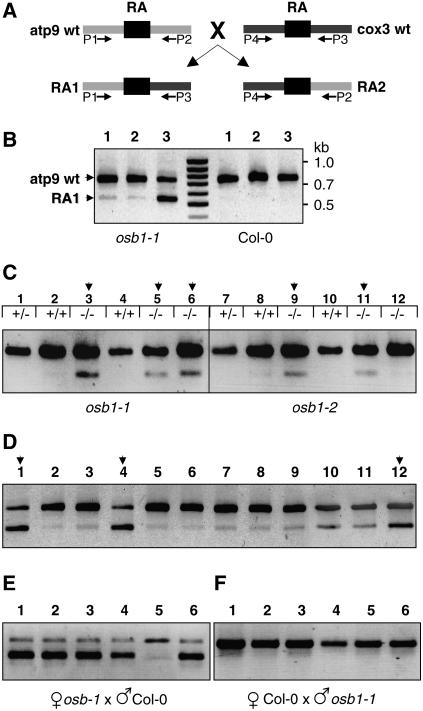
Accumulation of the RA1 Recombination Product in osb1 Mutants Affected by mtDNA Substoichiometric Shifting.
(A) Simplified scheme showing the RA repeats in wild-type Col-0 atp9 and cox3 contexts and the resulting recombination products RA1 and RA2. Primers P1 to P4 (Figure 7B) were used to amplify the four mtDNA configurations.
(B) Analysis by optimized competitive, three-primer PCR of three osb1-1 plants affected by shifting and of three Col-0 plants. The top band (P1 + P2) corresponds to wild-type atp9 (748 nucleotides), and the smaller fragment (P1 + P3) corresponds to the RA1 recombination product (546 nucleotides).
(C) Analysis of RA1 accumulation in the first generation of osb1 homozygous mutants. The OSB1 genotype of each plant is indicated. Homozygous plants 3, 5, 9, and 11 have increased levels of RA1 (stage I shift; as described in Results and in Supplemental Table 2 online).
(D) Progeny (generation T3) of homozygous plant 3 from (C): plants 1, 4, and 12 show much higher levels of RA1 than their siblings (stage II shift).
(E) Analysis of plants resulting from the backcrossing, as pollen receptor, of plant 4 from (D).
(F) Analysis of plants resulting from the reciprocal cross.

