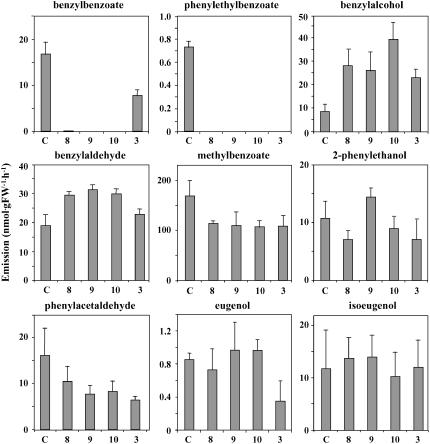
Figure 3.
Effect of BPBT Silencing on Emission of Benzenoid/Phenylpropanoid Compounds in Petunia Flowers.
Flowers from four independent BPBT RNAi lines, 8, 9, and 10 (knockouts) and 3 (knockdown), and control (C) were used for scent collection. Each graph represents the average of four to five independent experiments. Scent was collected for 12 h from detached flowers in the dark, and levels of volatiles were quantified by GC-MS. Emission rates are expressed on a per hour basis, assuming a constant emission rate over the 12-h period. Bars indicate sd.

