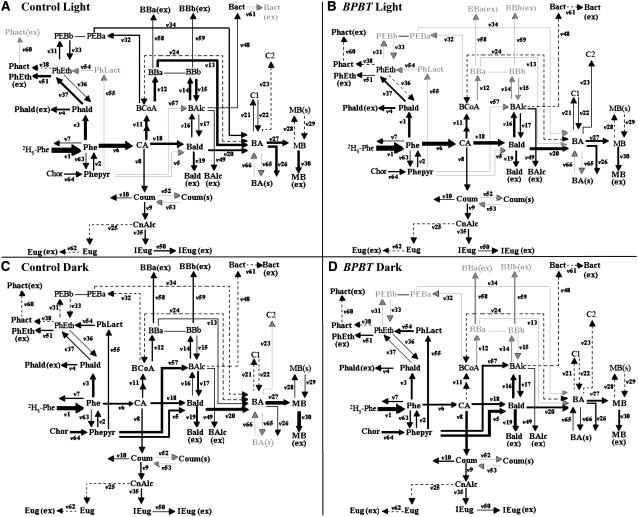
Figure 5.
Four Models Representing the Benzenoid Network in the Light and Dark in Control and BPBT Knockout Petunia Flowers.
Computer-assisted metabolic modeling was performed using in vivo labeling kinetics and pool sizes of benzenoid and phenylpropanoid compounds in petunia petal tissue supplied with 2H5-Phe for up to 4 h in light ([A] and [B]) and dark ([C] and [D]) conditions in control ([A] and [C]) and BPBT RNAi-10 transgenic ([B] and [D]) plants. Thickness of lines correlates with strength of flux (see Table 1). Gray arrows indicate the absence of flux, and dashed lines indicate very low flux rate. Bact, benzylacetate; BBa, benzylbenzoate BA moiety; BBb, benzylbenzoate BAlc moiety; C1 and C2, unidentified nonvolatile BA conjugates (Boatright et al., 2004); Chor, chorismic acid; CnAlc, coniferyl alcohol; Coum, coumaric acid; Eug, eugenol; PEBa, phenylethyl benzoate BA moiety; PEBb, phenylethyl benzoate 2-phenylethanol moiety; Phact, phenylethylacetate; PhLact, phenyllactic acid. For remaining abbreviations, see Figure 1.

