Figure 2.
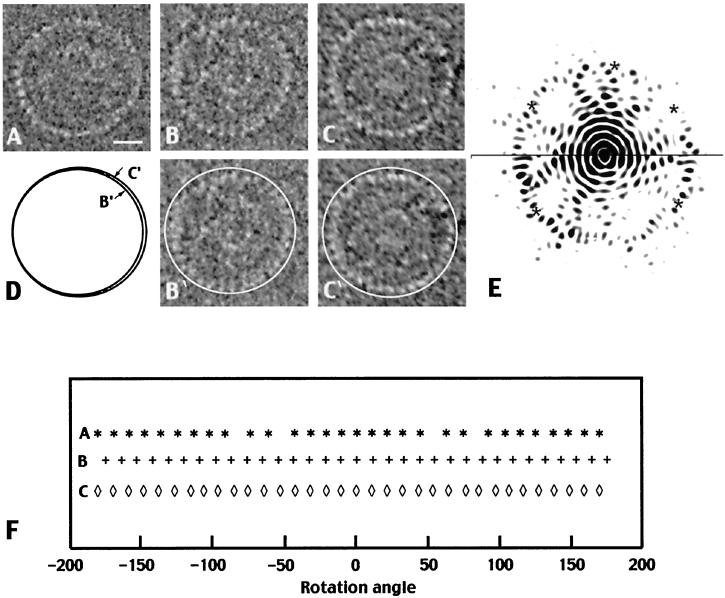
Gallery of basal-body images. (A–C) The three good top views. B′ and C′ are copies of B and C with ellipsoids drawn to correspond to the circumference of the rings. (D) A comparison of the two ellipsoids from B′ and C′ showing that the ring in B is smaller than that in C. (E) Fourier transforms of two top views spliced together (the top half corresponds to the ring in A; the bottom half corresponds to the ring in B). ∗ marks the positions of the J34 and J33 terms. The peaks in both transforms occur at a radius of 1/39 Å−1. (F) A plot of local cross-correlation peaks vs. rotation angle for the three top views shown in A–C. The peaks provide a measure of the number of subunits in each C ring. There should be one peak for each subunit. There are four gaps in the plot for the ring in A, which presumably correspond to four missing peaks. Allowing for these missing peaks, we determine that n = 34 count for the rings in A and C, and n = 33 for the ring in B. (Bar = 100 Å in A.)

