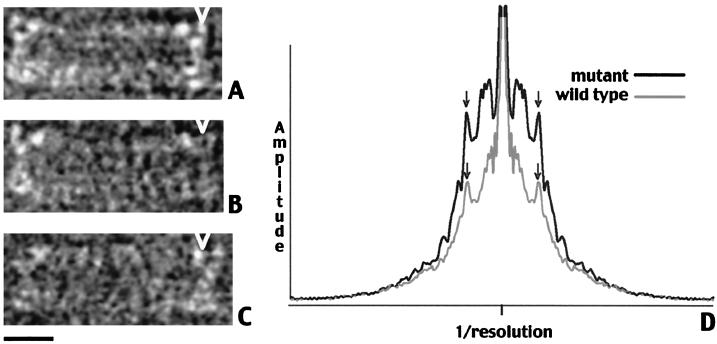
Figure 3.
(A–C) Three side views of the C ring. Note that the rings are of different diameter. The left sides are aligned, and one of the units in A is marked with an arrowhead. The arrowhead is repeated at the same spatial position in B and C to make the difference in diameter clearer. (Bar = 100 Å.) (D) Fourier transforms of side views. The side views are projected onto a line perpendicular to the axis. The projection of the average of these views (Fig. 4 A or B) is subtracted. The amplitude distribution of the Fourier transforms of these differences projections are averaged. The two curves display the amplitudes corresponding to the wild-type and to the deletion-fusion mutant. There are peaks at a radius of 1/39 Å−1 (see arrows), the same position as the peaks seen in Fig. 2E.

