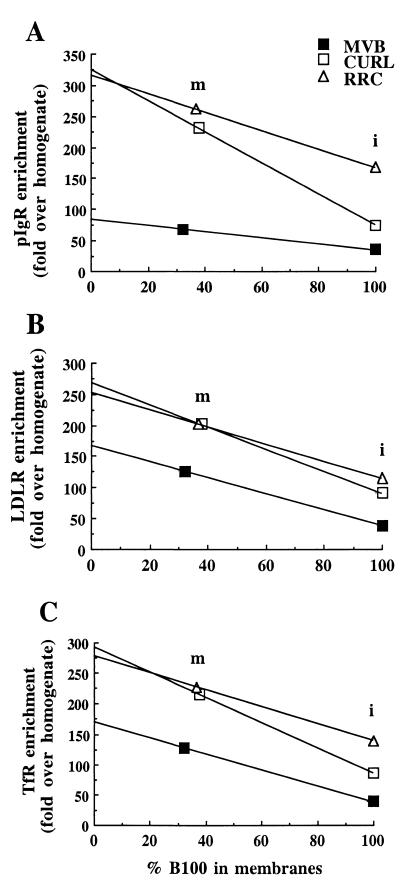
Figure 5.
Graphic representations showing the density of receptors versus the percentage of LDL remaining in the membranes. The x axis is the % apo B-100 (LDL) remaining in the membranes (m), taking the intact (noncarbonate stripped) fraction (i) as 100% for each endosome fraction. The y axis is the relative density of each receptor, expressed as fold enrichment over the total homogenate.

