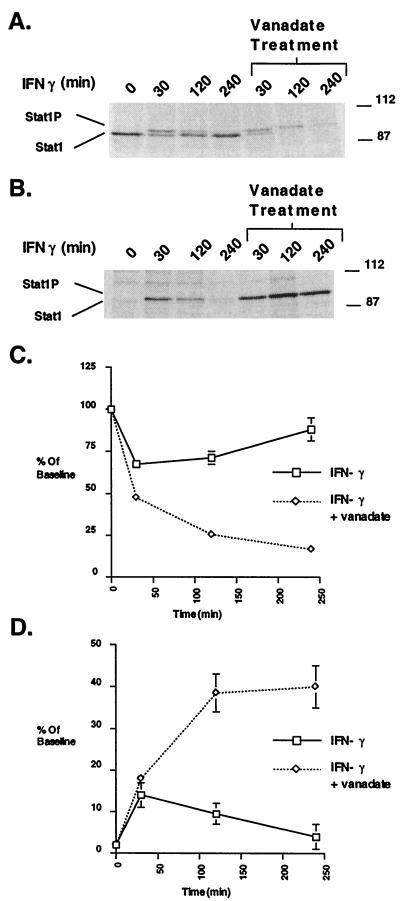
Figure 6.
The effect of vanadate on the Stat1 activation-inactivation cycle analyzed by 35S labeling. (A) 35S labeling followed by immunoprecipitation with an anti-Stat1 mAb. Bud-8 fibroblasts were labeled with 35S for 2.5 hr as described in Materials and Methods. Label was removed, cells were washed in normal medium, and IFN-γ or IFN-γ plus vanadate was added. At the indicated time points, cytoplasmic and nuclear extracts were prepared. The cytoplasmic extracts then were subjected to SDS/PAGE and autoradiography. (B) Same as A except SDS/PAGE and autoradiography of nuclear extracts. (C) Plot of the PhosphorImager analysis of the Stat1 bands (both phosphorylated and unphosphorylated) in cytoplasmic extracts averaged from two separate experiments. Data are expressed as percent of baseline (the value in the no treatment lane of the cytoplasmic extracts). Error bars represent the SEM. (D) Plot of the PhosphorImager analysis of the Stat1 bands (both phosphorylated and unphosphorylated) in nuclear extracts averaged from two separate experiments. Data are expressed as percent of baseline (the value in the no treatment lane of the cytoplasmic extracts). Error bars represent the SEM.

