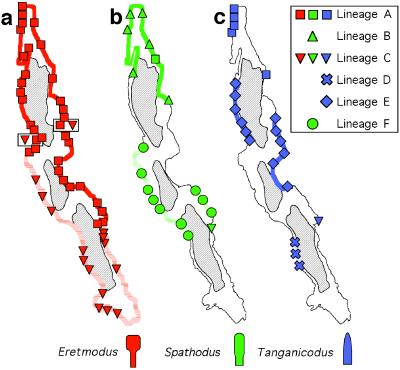
Figure 3.
Maps of Lake Tanganyika showing the haplotype distribution of the Eretmodini studied according to their tooth shape (3a, Eretmodus-; 3b, Spathodus-; and 3c, Tanganicodus-like). Different shadings distinguish the distribution of different mtDNA lineages with the same tooth shape (not shown for T. irsacae). The distribution ranges were inferred from field observations, specimen collections, and haplotypes. The symbols follow the assignments to lineages A–F as in Fig. 1 and are summarized in the box. The two localities where E. cyanostictus (lineage C) and E. cf. cyanostictus (lineage A) are found sympatric are indicated by a small box in a. The three isolated Pleistocene sub-basins are indicated in gray.

