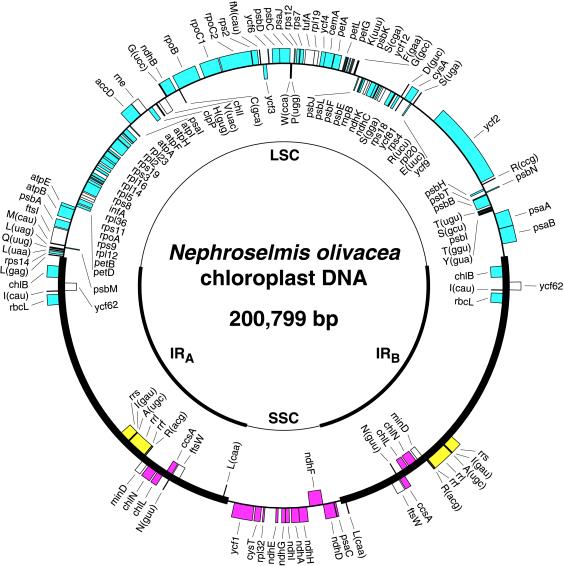
Figure 1.
Gene map of Nephroselmis cpDNA and compared patterns of gene partitioning in Marchantia and Nephroselmis cpDNAs. Thick lines represent the two copies of the IR (IRA and IRB). The relative orientation of the small single-copy (SSC) and large single-copy (LSC) regions is arbitrary in the representation shown. Genes on the outside of the map are transcribed in a clockwise direction; those inside the map are transcribed counterclockwise. The color-code denotes the genomic regions containing the homologous genes in Marchantia: cyan, LSC region; magenta, SSC region; and yellow, IR. Transfer RNA genes are indicated by the one-letter amino acid code followed by the anticodon in parentheses. The ORFs unique to Nephroselmis cpDNA are not indicated (see GenBank accession no. AF137379).

