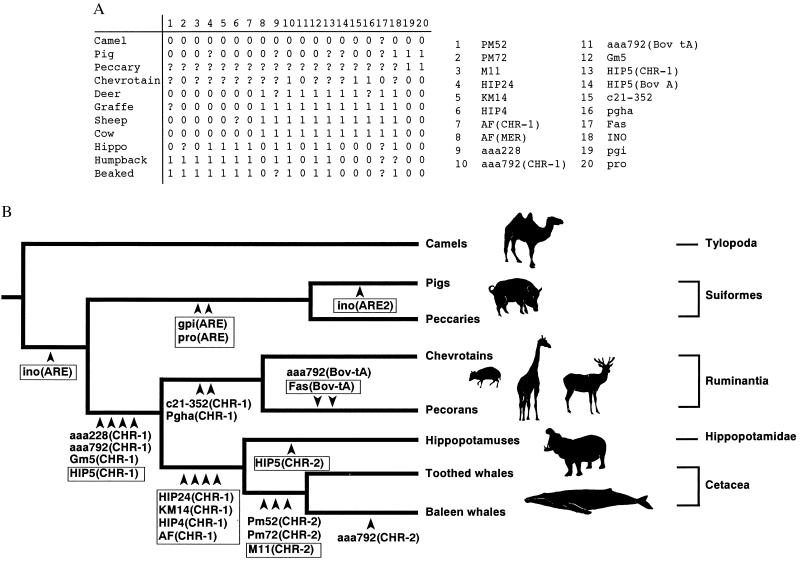
Figure 7.
Phylogenetic relationships among the major cetartiodactyl subgroups. (A) Data matrix showing the character states for each of the loci including those reported previously (15). The 20 retropositional events were analyzed and used to generate the phylogeny shown in B. 0 = absence; 1 = presence; ? = missing. (B) All insertion sites of SINEs and LINEs characterized to date are mapped on the phylogeny inferred from these data. Boxed loci indicate those loci discussed at length in this report, and the specific retroposon unit inserted at each locus is given in parentheses. The homoplasy index was 0.0, whereas the consistency, retention, and rescaled consistency indices were 1.0 for this tree, which was 20 steps in length (where each step represents an insertion event).

