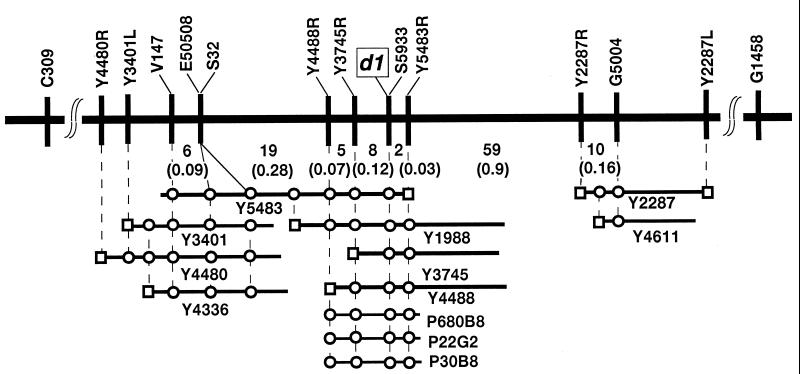
Figure 2.
High-resolution RFLP linkage map and physical map of the d1 locus. The vertical bar represents the RFLP markers, and the numbers of recombinants are indicated under the linkage map. Genetic distances between adjacent markers are shown in parentheses. □, End-fragment DNA of YAC clone; ○, RFLP markers or YAC end-fragment DNA contained in the YAC clones (Y number) and PAC clones (P number).

