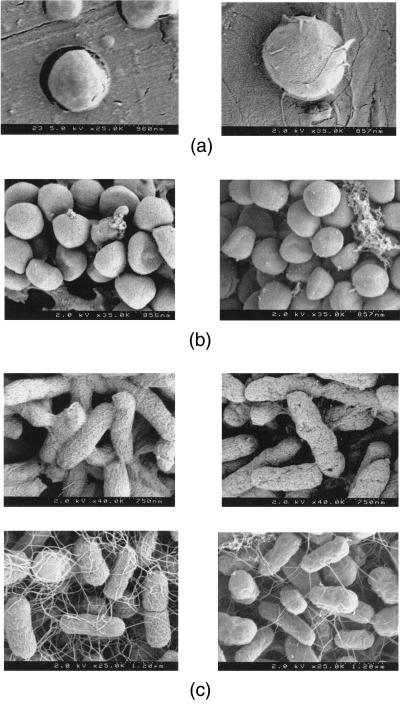
Figure 3.
(A) PLGA microsphere before (Left) and after (Right) sterilization at 25°C and 205 bar for 1 hr. (B Upper) S. aureus before (Left) and after (Right) SCF-sterilization process. (Lower) P. aeruginosa before (Left) and after (Right) SCF process. (C) E. coli before (Left) and after (Right) SCF sterilization.

