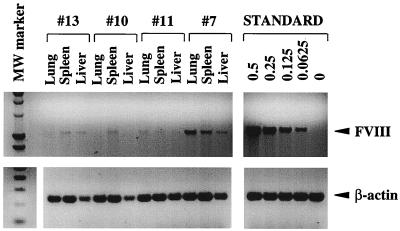
Figure 5.
Analysis of gene transfer efficiency by quantitative PCR in liver, spleen, and lungs of nonexpressor (10, 11, and 13, from Table 1) and transient expresser (7) mice. Bands corresponding to the amplified FVIII or control β-actin-specific fragments are indicated (1.1 and 0.2 kb, respectively). The same standard was used as described in the legend of Fig. 4. The molecular weight (MW) marker corresponds to the Smart Ladder for the FVIII-PCR and the 1-kb ladder for β-actin.

