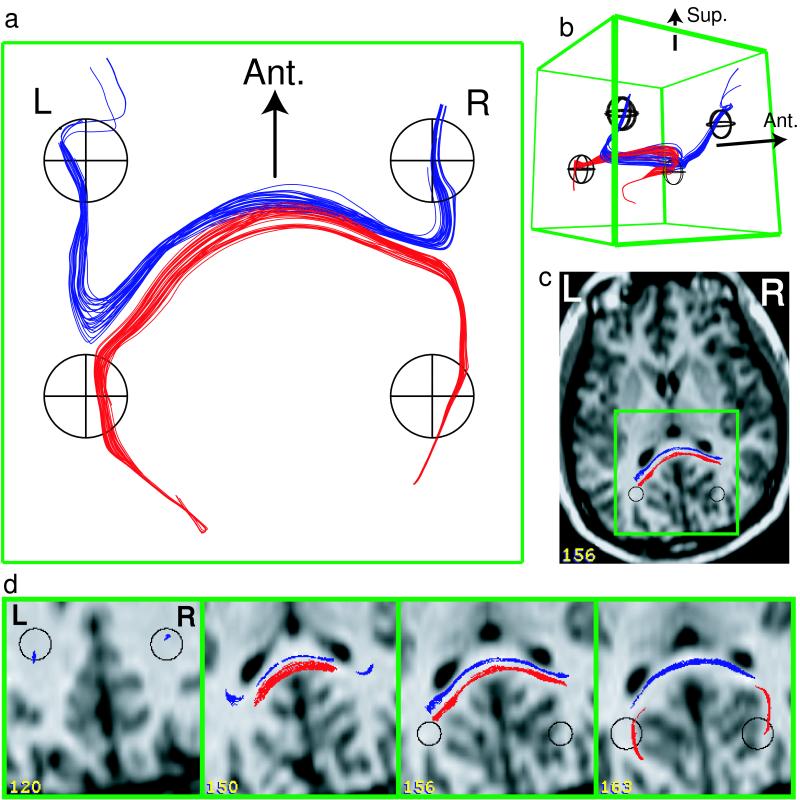
Figure 1.
Diffusion tracking of commissural fibers. 3D projection views (a and b) of diffusion tracks (red and blue) in the splenium of the corpus callosum selected with ellipsoid filtering volumes (black). Tracks are viewed from above (a) and from the anterior-right direction (b). In c, the general anatomical location of tracks and ellipsoids is shown in 2D overlay (see Methods) on a brain slice that cuts through the splenium (T1-weighted slice 156). Magnified 2D overlays (d) of tracks and ellipsoids onto selected slices (interpolated slices numbered superior-to-inferior with 24 slices/cm). The green boxed region surrounding the 3D projections (a and b) corresponds to the green squared regions on 2D anatomical overlays (c and d). Tracks were selected by ellipsoid filtration of whole-brain diffusion data (computed at an anisotropy threshold of Aσ ≥ 0.19). Tracks that passed through the splenium were observed to divide into two groups laterally and were color coded based on passage into lateral ellipsoids (black circles on all images). Tracks projected to the occipital lobes (red tracks) and parietal lobes (blue tracks), and had a topological relation within the splenium best seen in a and slice 156 in d. The oblique 3D view (b) shows the more superior projection of the parietal tracks (blue). Tracks were thinned by a factor of 8 for 3D display.

