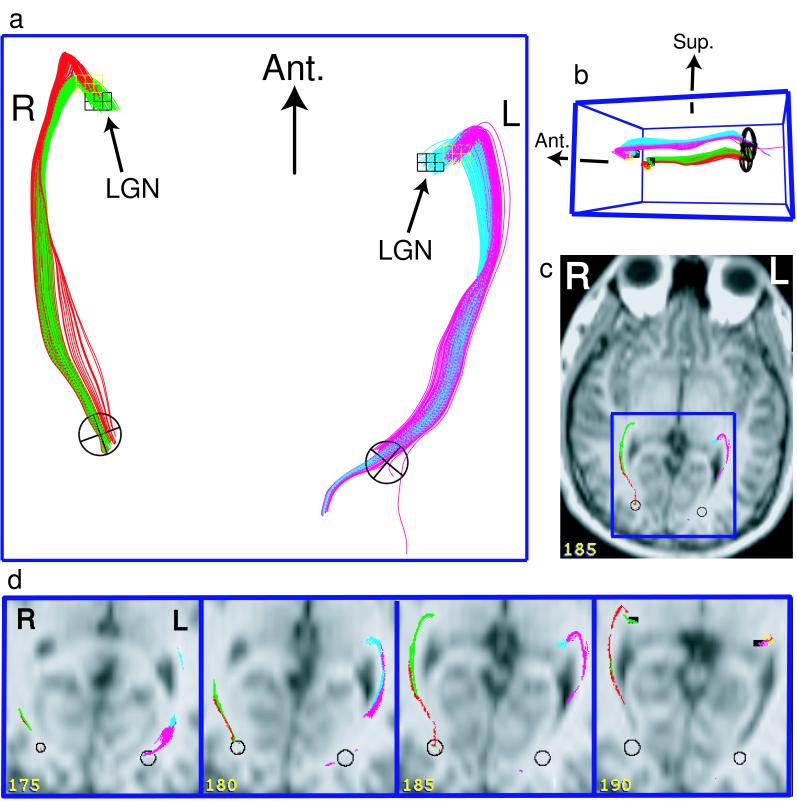
Figure 2.
Diffusion tracking of the geniculo-calcarine tracts. 3D projections (a and b) of tracks and filtering volumes (ellipsoids and small cubes) are viewed directly from below (a) and obliquely from the left (b). In c, the general anatomical location is shown in 2D overlay on one brain slice (slice 185) that was located near the midportion of the splenium. The detailed anatomical location is shown in magnified 2D overlay in d. The dark blue boxed regions correspond on all images. Tracks were anatomically selected from whole-brain track data (Aσ ≥ 0.14 threshold, same subject as Fig. 1). Tracks were retained that entered the ellipsoidal volumes located adjacent to visual cortex (lateral to the calcarine fissure) and the ipsilateral LGN volumes (cubes) manually drawn based on thalamic contours. LGN volumes were separated into medial (black cubes) and lateral (yellow cubes) parts for analysis of topology. A medial-lateral topology is demonstrated from the LGN to the optic radiations (best seen in a), and a superior-inferior topology is revealed along the length of the geniculo-calcarine tract (best seen in b).

