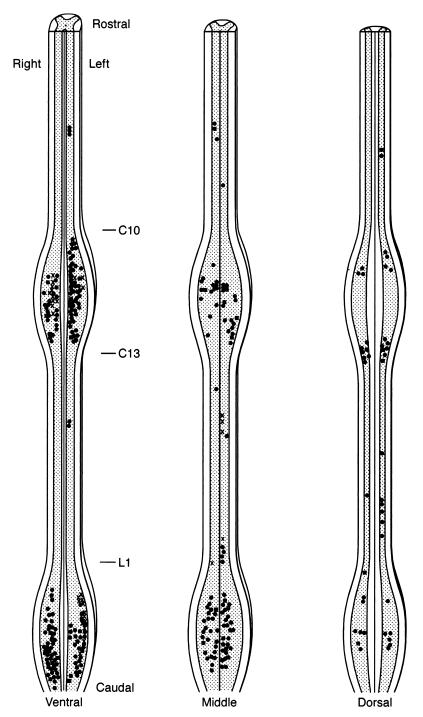
Figure 4.
Representative map showing the spatial distribution of sex steroid-accumulating cells in the golden-collard manakin spinal cord. Each symbol represents three cells, with isolated cells omitted; black dots represent cells found in males; X represents cells found in females (see text for details). The cord is illustrated at three levels; all cells found within a given level are illustrated: Ventral, the entire cord ventral to the bifurcation of the ventral horns, including most of lamina IX and much of lamina VIII of Leonard and Cohen (1975); dorsal, the entire cord dorsal to the beginning of the bifurcation of the dorsal horns out to their tips, including all of lamina I–IV of Leonard and Cohen (1975) and part of lamina V; middle, the remaining cord between the ventral and dorsal levels. Table 1 illustrates individual differences in the pattern of accumulation.

