Figure 1.
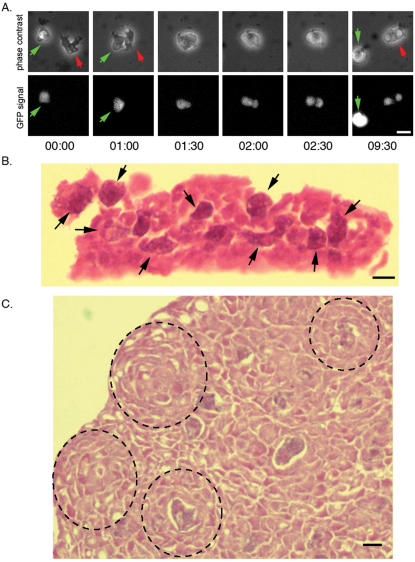
The phagocytosis of D. discoideum by D. caveatum. A. Time series of phagocytosis. A red-labeled D. caveatum amoeba (red arrow) phagocytoses a GFP-expressing D. discoideum amoeba (green arrow). Engulfment is complete within 2 minutes following contact. The prey cell is fragmented into several phagosomes within the same time frame (see GFP-positive fragments at 2.5 minutes following contact). After less than 10 minutes, phagocytosis is complete and the D. caveatum amoeba resumes migration until it comes into contact with another prey cell. Time is in minutes and seconds (MM:SS, see Movie S1A and S1B). Bar = 10 µm. B. Histological section of D. caveatum amoebae in an aggregate where the prey cells were initially at 1 D. caveatum for 1000 prey cells. D. caveatum amoebae are presumably the large darker cells showing a cytoplasmic basophilic straining (arrows), containing material resembling the majority of cells in the aggregate (fragments of D. discoideum cells). This section was prepared 16 hours after the beginning of development. Bar = 10 µm. C. Histological section of an aggregate in which nearly all D. discoideum amoebae have been consumed and only D. caveatum cells remain. These cells are packed in dense aggregates, and a few of them still contain remnants of D. discoideum amoebae. Dotted lines have been drawn around foci of aggregating D. caveatum within the cellular mass. This section corresponds to 36 hours after the beginning of development. Bar = 10 µm.

