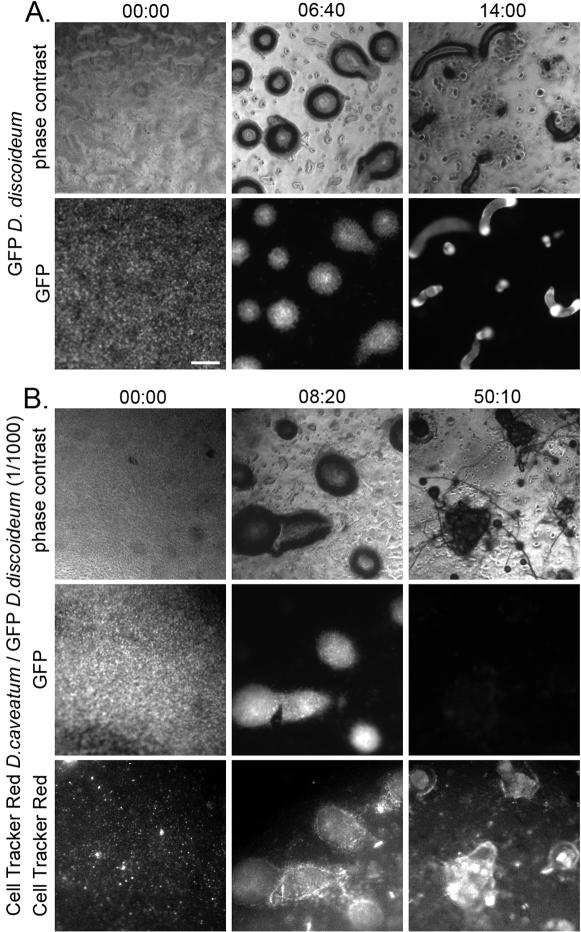
Figure 2.
Time-lapse microscopy of the development of D. caveatum/D. discoideum mixtures. Cells of control GFP-expressing D. discoideum populations (A) and GFP-expressing D. discoideum populations containing 1/103 Cell Tracker Red-labeled D. caveatum (B) were allowed to develop for 36 hours and continuously observed by time-lapse video microscopy. A. The control D. discoideum cultures undergo development from aggregation to fruiting (collective circular motion within aggregates is observed; see Movie S2A). Three stages are shown here: beginning of development (before aggregation), the tight aggregate stage, and the slug stage. Time is in HH:MM and 00:00 corresponds to the beginning of recording, during the initiation of aggregation. Bar = 200 µm. B. Aggregates infected with D. caveatum are blocked at the aggregate stage and no collective circular motion is observed (see Movie S2B). Finally D. caveatum amoebae emerge as slugs and fruiting bodies when all of D. discoideum amoebae are consumed (and the GFP signal disappears).

