
Figure 4.
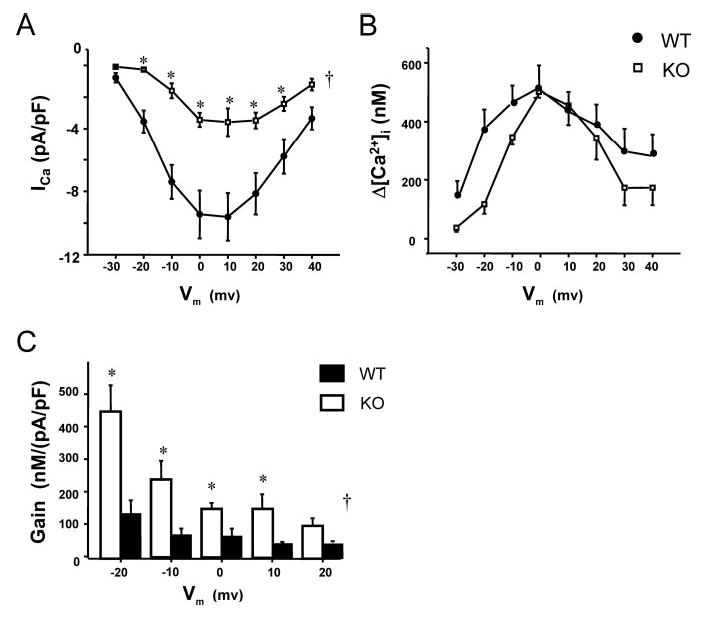
Summary data for the voltage dependence of L-type Ca2+ current, intracellular Ca2+ transients, and EC-coupling gain in WT vs KO. In KO, a clear reduction in peak ICa is observed at all voltages (A), whereas the corresponding Δ[Ca2+]i is largely unaffected (B). Bar graphs (C) show EC-coupling gain, calculated as Δ[Ca2+]i divided by ICa for KO (n=4, except for −20 to 0 mV, n=3) vs WT (n=7). Gain was higher in KO across all voltages. †P<0.05 for KO vs WT by 2-way ANOVA. *P<0.05 at indicated voltages by Fisher–Tukey post hoc testing.