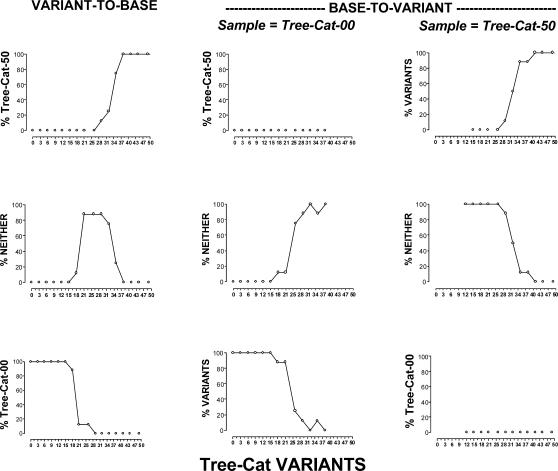
Fig 2. The results of the variant-to-base and base-to-variant tests for Subject 40 in Phase 3 of Experiment 1.
The three graphs in the left column indicate results of the variant-to-base tests and plot the percentage of selecting Tree-Cat-00 (bottom), the neither comparison (middle), and Tree-Cat-50 (top) as functions of the value of the Tree–Cat variants presented as samples. The results of the base-to-variant tests are presented in the two remaining columns. The graphs in the middle column plot the likelihoods of selecting the Tree–Cat variants (bottom), the neither comparison (middle), or the negative comparison (top) in the presence of Tree-Cat-00 as functions of the values of the Tree–Cat variants presented as comparisons. The right column plots likelihoods of selecting the Tree–Cat variants (top), the neither comparison (middle), or the negative comparison (bottom) in the presence of Tree-Cat-50 as functions of the values of the Tree–Cat variants presented as comparisons.

