Figure 4.

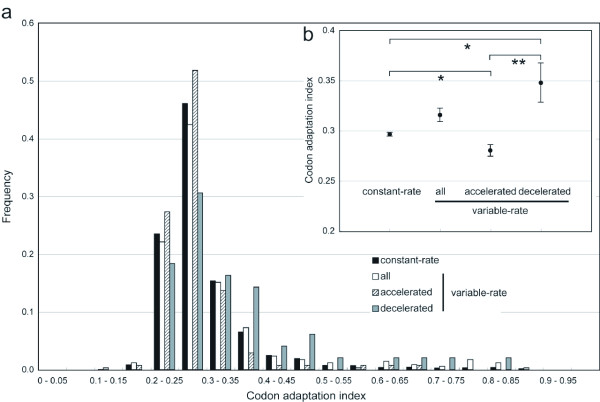
Relationship between the variations in rate of protein evolution and codon adaptation index. (a) Histogram showing the distribution of codon adaptation index for the genes with constant evolutionary rates and the three groups of the genes with evolutionary rate changes. (b) The means of codon adaptation index with standard errors were shown. Statistically significant differences in codon adaptation index between groups are indicated by asterisks (*: P < 0.05, **: P < 0.01)
