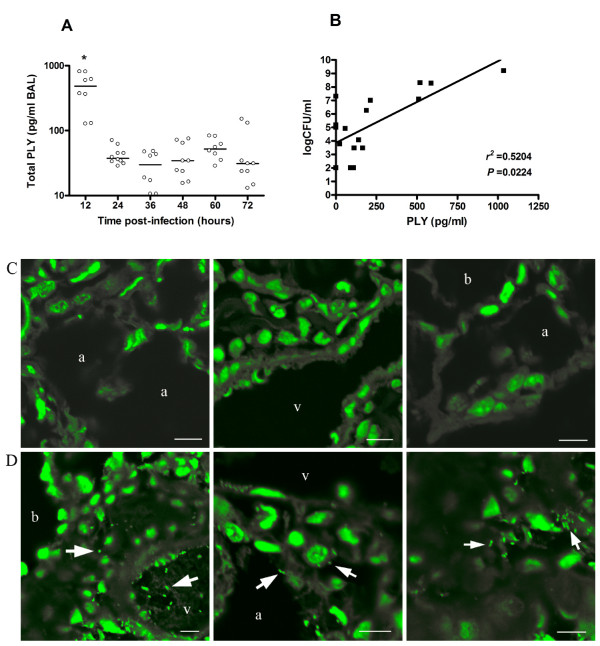
Figure 1.
Concentrations of PLY and bacteria localization in lungs of mice infected with S. pneumoniae D39 serotype 2. (A) Amounts of total PLY were quantified in BAL after lysis of bacteria. Each symbol represents one mouse, and horizontal bars represent medians. Results are representative of three independent experiments. Groups were compared by nonparametric Mann-Whitney U test. * P < 0.05. (B) Correlation between CFU and PLY in BAL. Dots represent the means of CFU versus PLY concentration from three mice at the same time points of Fig. 1A Correlation was performed by nonparametric Spearman r-test. (C) Confocal images of lung tissue sections from uninfected mice. (D) Representative lung tissue sections from pneumococci infected mice showing intra-vessel, intra-cytoplasmic and intercellular bacteria localization. Blood vessel (v), alveolar space (a), bronchiole (b). Scale bars 8 μm. All images were captured after a Z-stack analysis of the samples.

