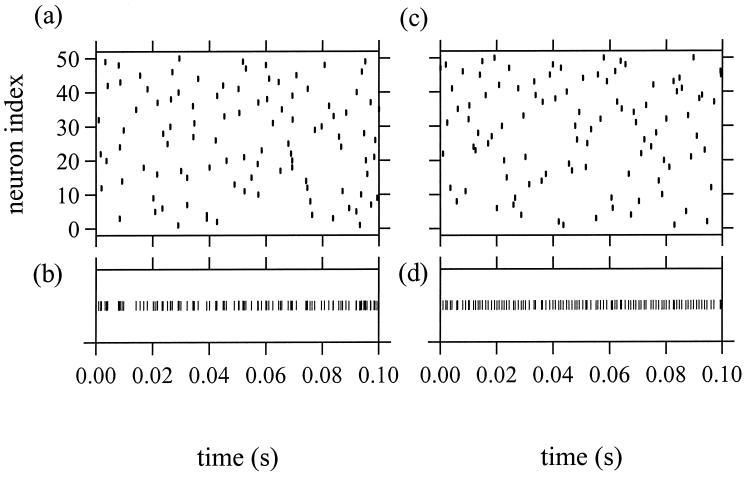
Figure 1.
Raster plots of the firing events for uncoupled (a and b) and coupled (c and d) networks of N = 50 elements (Eqs. 1 and 2). The network heterogeneity αi is uniformly distributed in the interval (1.27, 1.50), corresponding to the bottom and top of a and c, and the overall network firing rate in both cases is FN = 1.000 × 10³ ± 1 Hz. In b and d, the raster plots are collapsed into a collective record for the entire network. The membrane and synapse times are τm = 1 s and τs = 10−3 s, respectively. The coupling strength and applied current, respectively, are K = 0 and I0 = 9.48 (a and b) and K = 50.0 and I0 = 47.3 (c and d).

