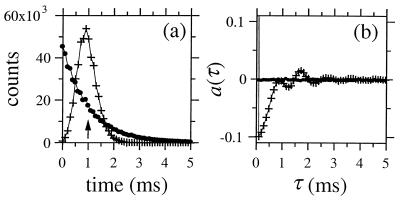
Figure 2.
(a) Histogram of ISIs for the collective firing output of the network (see Fig. 1 b and d) taken for trial durations of 200 s and a bin width of 0.1 ms. The inverse population rate FN−1 = 1.0 ms is indicated by the arrow. (b) Autocorrelation of the collective firing record (see Fig. 1 b and d) taken for 200 s and using a sampling interval of 0.1 ms. For both a and b, dots (●) and crosses (+) represent data for the uncoupled and coupled networks, respectively. Lines between points are drawn to guide the eye.

