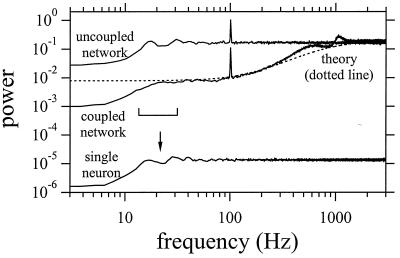
Figure 3.
Power spectra for a network of N = 50 neurons whose dynamics are given by Eqs. 1 and 2. The top trace is for the uncoupled network (K = 0, I0 = 9.48) and the middle trace is for a coupled network (K = 50.0, I0 = 47.3). In both cases, the input signal current is I(t) = I0 + A sin(2πf0t), where f0 = 100 Hz and A = 2.365. Other system parameters are as specified in the caption of Fig. 1. In the coupled case, the lower quantization noise below fc = 800 Hz corresponds to larger DR. The measured SNR at f0 is 8.1 dB in the uncoupled network and 10.6 dB in the coupled network. The scale bar between 12 and 28 Hz indicates the range of individual neuron firing rates in the coupled network. The dotted line is the theoretical prediction from Eq. 7. The bottom trace is the spectrum for a single representative neuron selected from the coupled network. The mean firing rate of this neuron is 19 Hz (see arrow).

