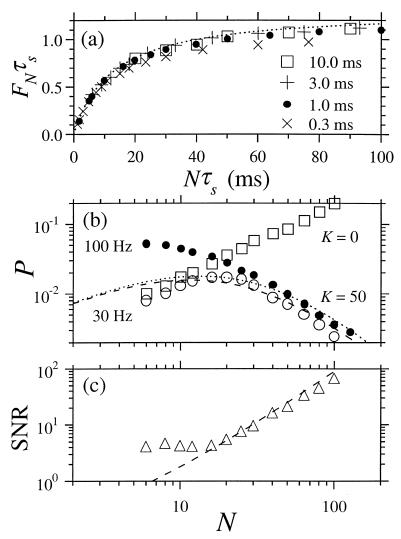
Figure 4.
Dependence of network firing behavior on the population size N. (a) Population firing rate FN vs. N, where both axes have been scaled by τs. The network parameters are identical to those in Figs. 1–3, with the exception of N and τs. ×, ●, +, and □ represent data for τs = 0.3, 1, 3, and 10 ms, respectively. The dotted line is the theoretical rate obtained from Eq. 6. (b) Log–log plot of measured quantization noise power P at 100 Hz (●) and 30 Hz (open symbols) vs. N, taken with τs = 1 ms, I0 = 47.3, A = 0, and other parameters as in Figs. 1–3. Squares and circles represent data for uncoupled (K = 0) and coupled (K = 50) networks, respectively. (c) Log–log plot of SNR vs. N measured at f = 30 Hz for a network with K = 50 and A = 2.365. In b and c, theoretical predictions obtained from Eqs. 6 and 7 for the coupled networks are shown by a dotted line (f = 100 Hz) and dashed lines (f = 30 Hz), respectively.

