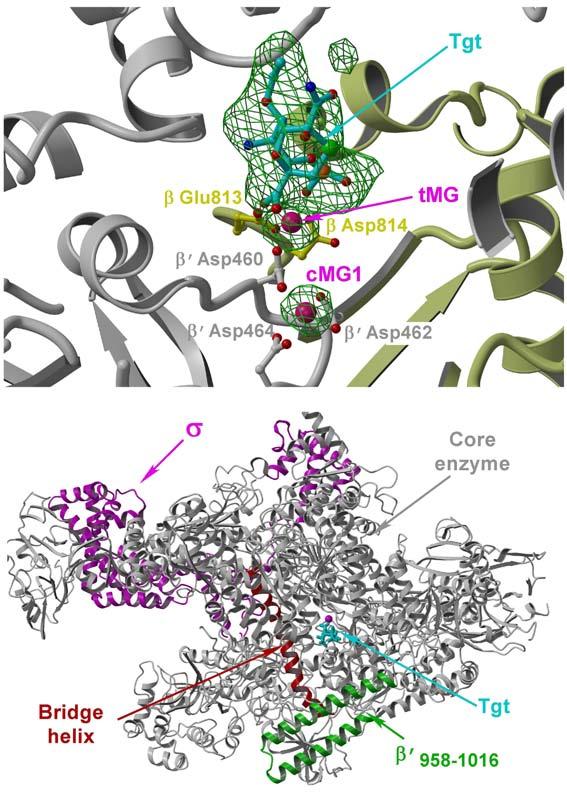
Figure 1.

RNAP/Tgt structure. (a) Experimental 3.5Å resolution and |FTgt - Fnati| (3.0σ level both) omit ED map (green) superimposed on the RNAP1/Tgt structure. The residues (balls-and-sticks) and protein backbone (ribbon diagram) of the β and β′ subunits are shown in yellow and gray, respectively. In this and following figures, cMG1, cMG2, and tMG designate high- and low-affinity catalytic and Tgt-bound Mg2+ ions, respectively. (b) Overall view of the RNAP/Tgt complex structure showing that Tgt binds within the secondary channel in close vicinity to the active site (marked by cMG1, magenta sphere).
