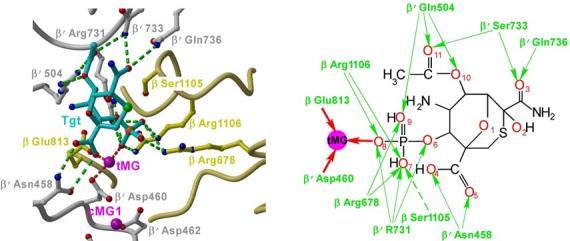
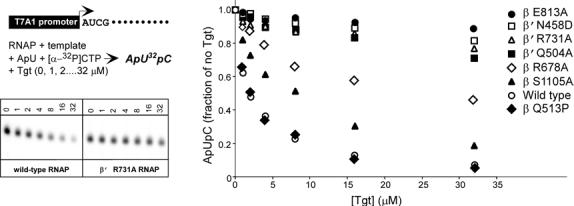
Figure 2.


The Tgt-binding site. (a,b) A model (a) and schematic drawing (b) of the Tgt-binding site on RNAP. Residues that are not identical between E. coli and T. thermophilus are marked by their numbers only. Polar interactions are in red (tMG coordination bonds) or green (hydrogen bonds) dashed lines (a) and arrows (b). Weak contacts of β Ser1105 with Tgt are represented by a dashed arrow (b). (c) Sequence alignment of the β and β′ subunits from bacterial (E. coli, Eco; T. thermophilus, Tth), chloroplast (Arabidopsis thaliana, Ath), and yeast Saccharomyces cerevisiae (pol II, Sc II; and pol III, Sc III) enzymes in regions flanking the Tgt contact sites using DNAStar MegAlign Module. The Tgt structural determinants are highlighted by green boxes; residues substituted for the in vitro analysis are indicated by black arrows. (d) Inhibition of abortive transcription on the T7A1 promoter by Tgt. Formation of the radiolabeled ApUpC RNAs was followed as a function of Tgt concentration (from 0 to 32 μM) with wild-type or altered ecRNAP. The key is shown in the figure.
