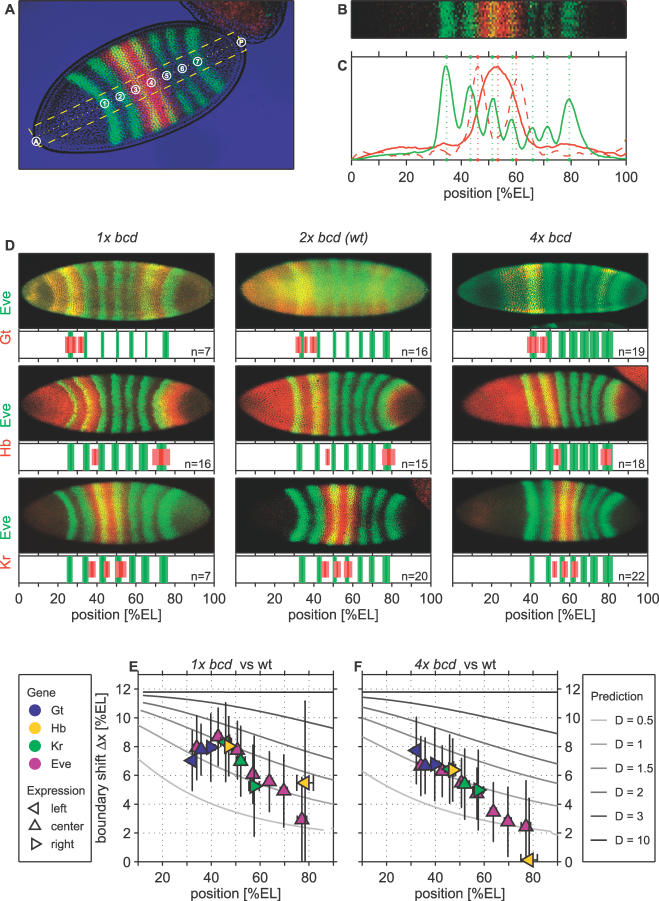
Figure 3. Quantitative Effects of Altered Maternal bcd Gene Dosage on Zygotic Target Gene Expression.
(A) Dorsal view of a representative cycle-14 wild-type Drosophila embryo stained for the Eve (green) and Kr (red) proteins. The contours of the embryo were determined from the transmitted light image (blue).
(B) (C) Quantitative analysis of stripe positions was performed by semiautomated software as follows: the positions of the embryo poles and of the first and last Eve stripes were defined manually. Based on these definitions, a rectangular area (yellow dashed in [A]) corresponding in height to 10% EL was extracted automatically. Intensity profiles (solid lines in [C]) were obtained by averaging the fluorescence signal along the dorsal–ventral axis in this area and subsequent smoothing. Stripe positions (green dotted lines in [C]) and boundaries (red dotted lines in [C]) were defined based on local maxima of these profiles and their first derivative, respectively.
(D) Expression domains of Eve (green) and the gap genes Gt, Hb, or Kr (red; as indicated) in embryos derived from females bearing one, two, or four copies of bcd. In each panel, the top part displays a representative confocal image, while quantitative results obtained from multiple embryos are shown at the bottom part. The widths of the stripes correspond to the standard errors (bright) and deviations (shaded). n denotes the number of embryos used in each analysis.
(E) Observed shifts of target gene expression domains (center, left, and right boundaries, if applicable) in embryos with one functional bcd allele (1 × bcd) as a function of the wild-type (2 × bcd) position. Gray lines indicate theoretical predictions for different Bcd decay times (compare with Figure 1G and 1H).
(F) Same as in (G) but for embryos with four copies of bcd (4 × bcd).

